The Display Tab
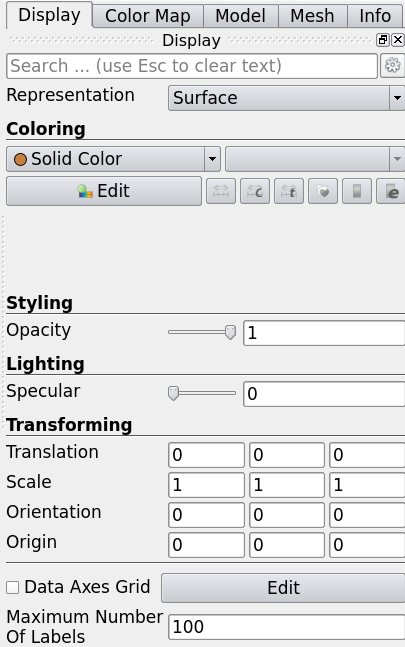
The Display Tab contains various options related to displaying the model.
“Representation” changes the way the model is displayed in the viewport
3D Glyphs: show the 3D glyphs at the underlying points
Outline: display the bounding box of the model
Point Gaussian: show the underlying points as solid spheres
Points: show the underlying points as solid dots
Surface: hide the underlying polygons, faces, etc.
Surface With Edges: display the surface and the underlying edges
Wireframe: display the wireframe of the underlying structures
When viewing the mesh of an object, it may be worth switching the representation to “Wireframe” or “Surface with edges”
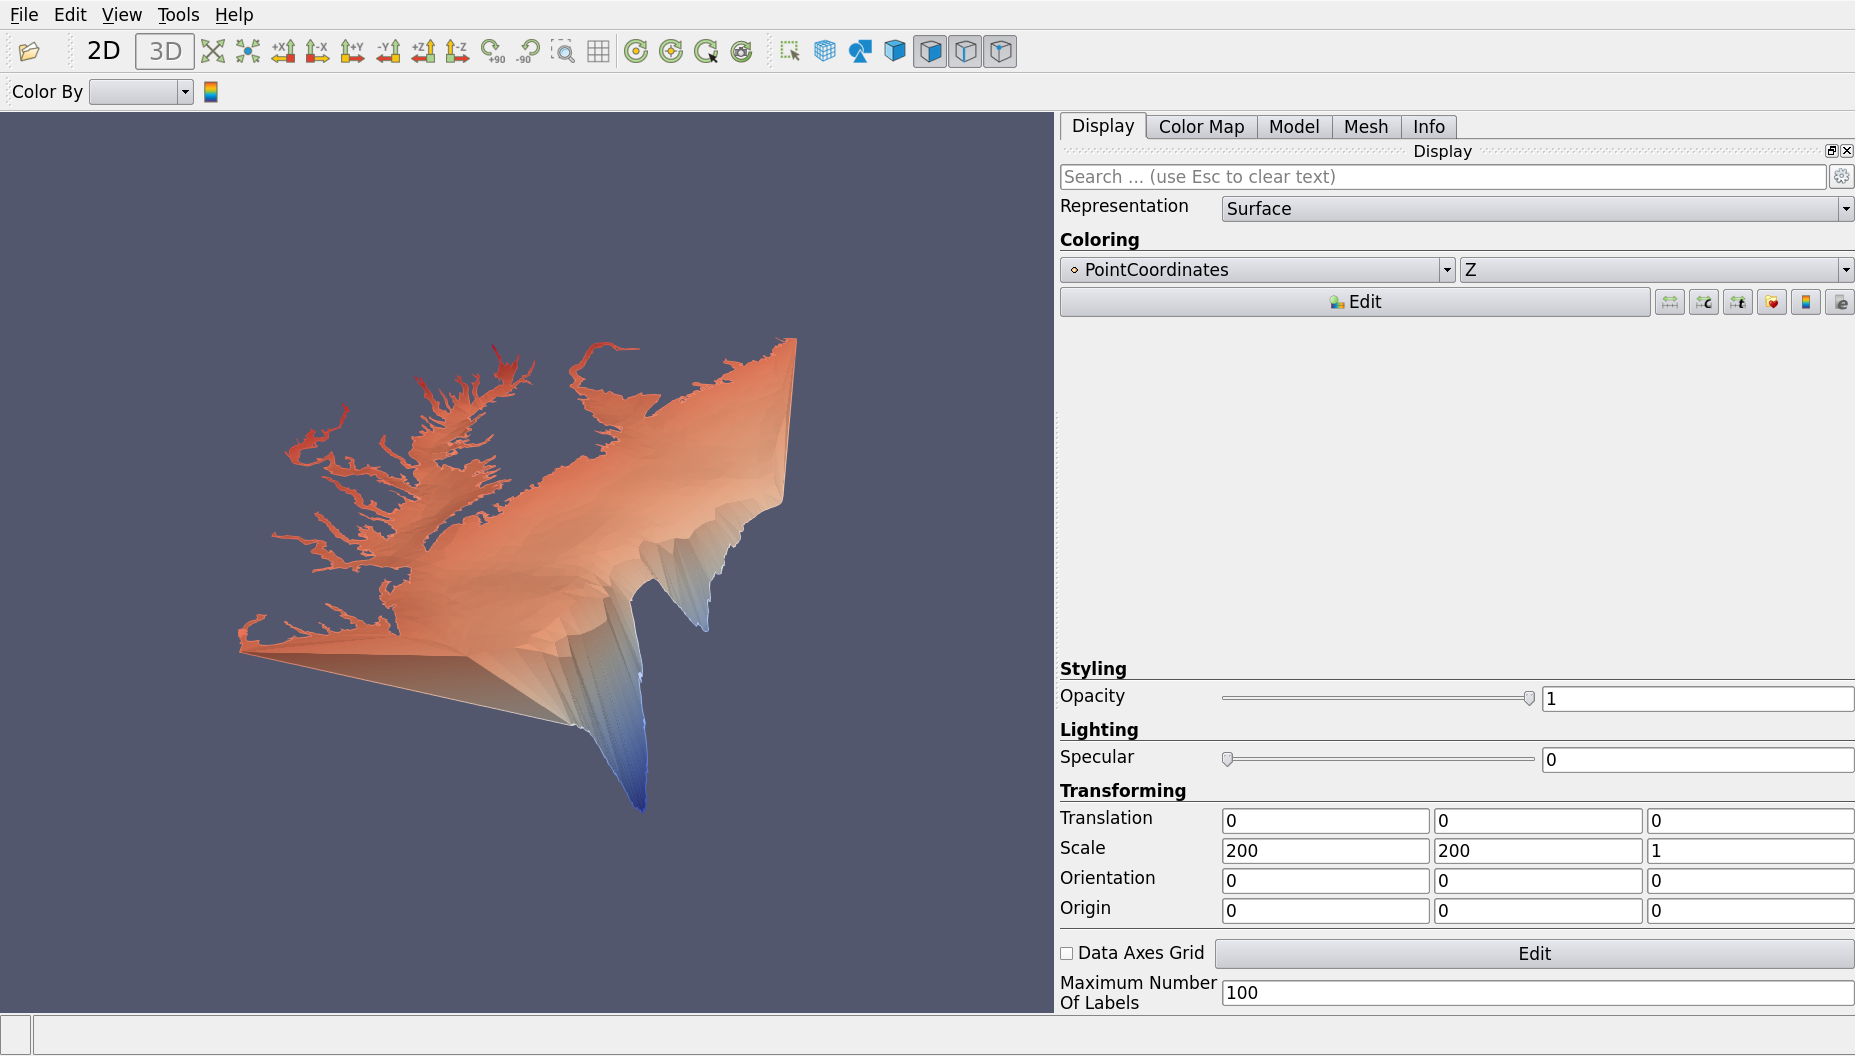
Coloring
The model can be colored by certain variables, which could not be done with “Color By” menu. For example, we can color the ChesapeakeBayContour introduced in Discrete Session with its Z coordinate.
Styling
Opacity: control the transparency of the model
Lighting
Specular: control the specularity of the model
Transforming
Translation: translate the model in 3D
Scale: scale the model
Orientation: define the orientation of the model
Origin: define the center of the model
Miscellaneous
Data Axes Grid: display axes grid that helps to visualize the data
Maximum Number of Labels: control the number of labels